English
  Italiano
 Complesso Universitario
di Monte Sant'Angelo (Ed. 10)
Via Vicinale Cupa Cintia 21
Via Vicinale Cupa Cintia 21
80126 NAPOLI
+39 81 2532146
![]()
Staff: Nunziata C., Costanzo M.R.
Main active collaborations:
Romanelli F., Peresan A., Vaccari F., Department of Mathematics and geosciences, Univ. Trieste
Indirli M., ENEA, Italian National Agency for New Technologies, Energy and Sustainable Economic Development
Antonio Formisano, Dept. of Structures for Engineering and Architecture, Univ. Napoli Federico II
Research activity is based on the deterministic approach of the ground motion evaluation. Realistic seismograms (volume and surface waves) are computed, for scaled point or extended sources, with a hybrid technique consisting of modal summation and finite difference methods (Fig.1). The modal summation technique is used to compute ground motion in the 1-D layered anelastic structure. The resulting wavefield, for both SH- and P-SV- waves, is then used to define the boundary conditions to be applied to the 2-D anelastic region where the finite difference technique is used. Synthetic seismograms of the vertical, transverse and radial components of ground motion are computed at a predefined set of points at the surface. Spectral amplifications are computed as response spectra ratios, i.e. the response spectra computed from the signals synthesized along the laterally varying section (2-D) normalized by the response spectra computed from the corresponding signals, synthesized for the bedrock (1-D).
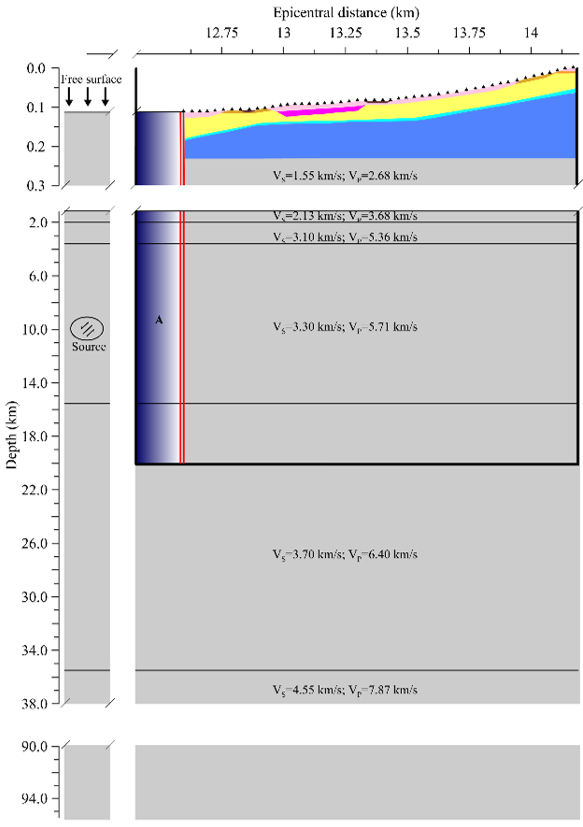 Fig. 1 Schematic representation of the hybrid method. The thick black lines represent the artificial boundaries for the finite difference grid. The time series computed with modal summation method for the 1-D layered anelastic structure (95 km thick) are used as input along two vertical grid lines (red lines) in the finite difference calculations. Seismograms are computed at a set of receivers (black triangles) along the cross-section.
The key point for a realistic estimate of the ground motion is the definition of shear seismic velocities (VS) with depth. Vs models are defined at depths ranging from tens of metres to tens of kilometres. Such models are obtained through the non-linear inversion (Hedgehog method) of the group velocity dispersion curve of the fundamental mode of Rayleigh waves, generated both naturally (earthquakes and noise) and artificially (weight drop or explosive). Group velocities of Rayleigh waves fundamental mode are obtained by the use of the Frequency Time Analysis (FTAN) applied to a seismic signal.
In recent years successful experiments of the Green's function (surface waves) extraction from noise cross-correlations between two recording stations have been performed both on a local scale (inter-station distance of tens of kilometers) and on a small scale (inter-station distance of 60-4000 m) in the urban area of Napoli. The results of this research are very important because they have demonstrated the repeatability and robustness of the cross-correlation of seismic noise signals and its powerful capability to investigate prohibitive depths in urban areas, without drilling and source.
Comparisons with methodologies based on phase velocities (SASW, f-k, MASW) and measurements in holes have allowed to establish that FTAN method provides excellent results and is particularly recommendable for measurements in highly urbanized cities because (1) it requires only one receiver on the surface, (2) does not care of the noise, and (3) the VS models are in excellent agreement with cross-hole and down-hole measurements.
Main results of the research:
1) Seismo-stratigraphies of the urban area of Napoli (Fig. 2);
2) A method of evaluation of the liquefaction hazard;
3) Reconstruction of the crust and upper mantle structures below the volcanic areas of Campi Flegrei, Mt. Vesuvius and Roccamonfina, the Neapolitan area and the Campanian Plain (Fig. 3).
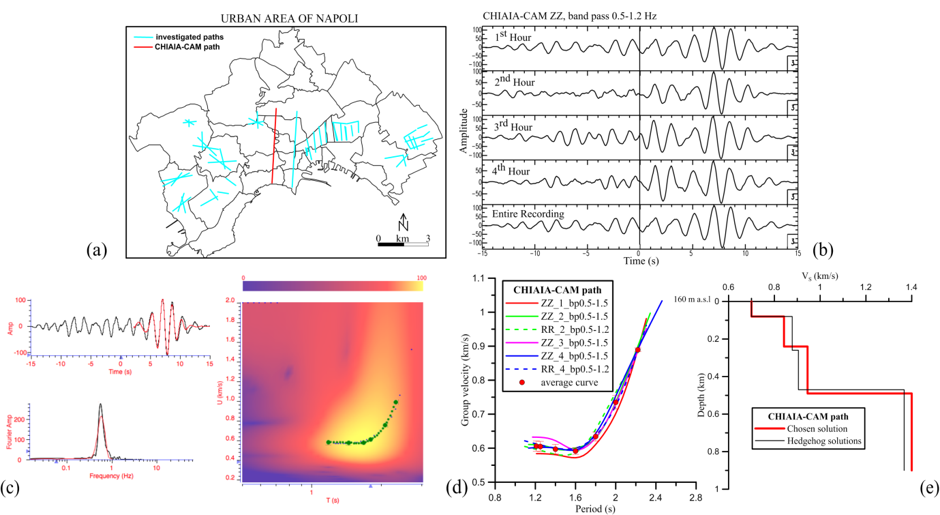 Fig. 2 Example of VS models in the urban area of Napoli (e) obtained by the non-linear inversion (Hedgehog method) of group velocities of fundamental mode Rayleigh waves (d) extracted by the FTAN method (c) from the cross-correlation functions (b) computed between pair of receivers (red line in a).
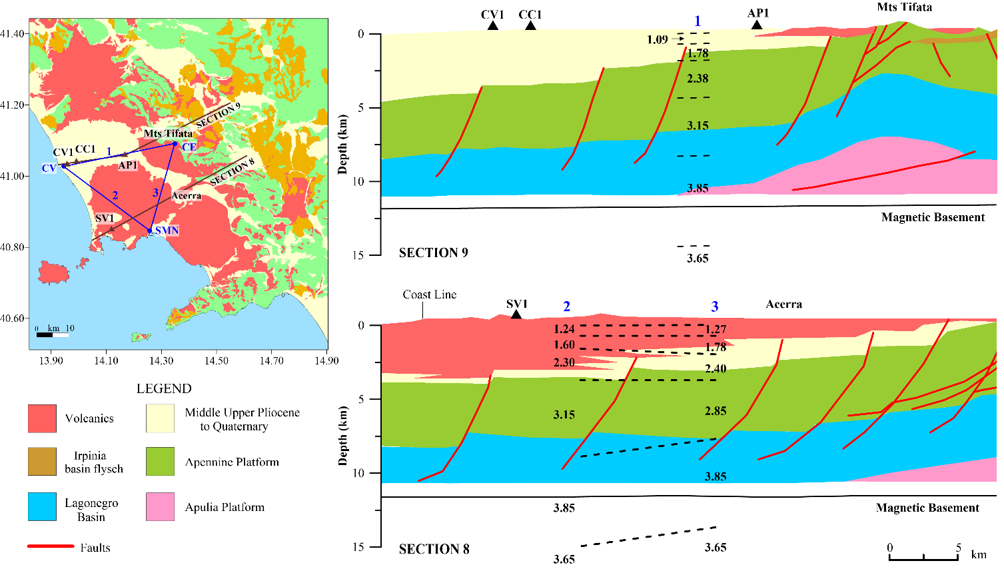 Fig. 3 VS models below the Campanian Plain compared with the geological sections 8-9 (modified after Mostardini and Merlini, 1986) at the crossing points (1-2-3) with the investigated paths. An agreement is found up to depths of ~ 8 km, but the layer with VS=3.85 km/s can be attributed to metamorphic rocks, not to Lagonegro basin sedimentary rocks
Seismic Microzoning studies have been performed at Napoli, Fabriano, Nocera Umbra, Sellano, Catania, L’Aquila and Poggio Picenze.
As an example the main results of the ground motion modeling for the 6 April 2009 earthquake (MW 6.3) at Poggio Picenze (central Italy) are shown.
The town of Poggio Picenze, located ~12 km SE of L’Aquila, reported a damage intensity of VIII-IX (MCS) for the 6 April 2009 earthquake. In the following days, two stations (M128 and PGG) were operating in the historical centre and recorded several aftershocks.
First, recordings of sixteen aftershocks (2.0 ≤ ML ≤ 4.2), located in the epicentral area of the strong event (MW 6.3), were processed to define VS profiles with depth through the non-linear inversion of Rayleigh wave group velocity dispersion curves of the fundamental mode extracted with the frequency-time analysis (Fig. 4).
Then, the local average VS model and the regional model, in addition to two shallow down-hole measurements, were used to define two 2-D cross-sections passing through the M128 and PGG seismic stations (Fig. 5). Ground motion was modeled along such cross-sections for the strongest aftershock and compared with the recorded one.
Once validated the modeling results (Fig. 6), the ground motion was computed for the 6 April 2009 earthquake (Fig. 7). Spectral amplifications up to a factor 5-6 are estimated at 3-4 Hz for the vertical component, and up to a factor 2-3 at 2-6 Hz for the radial and transverse components. Ground accelerations are maximum in the horizontal plane, along the transverse component (around 0.4 g) and are half along the vertical component.
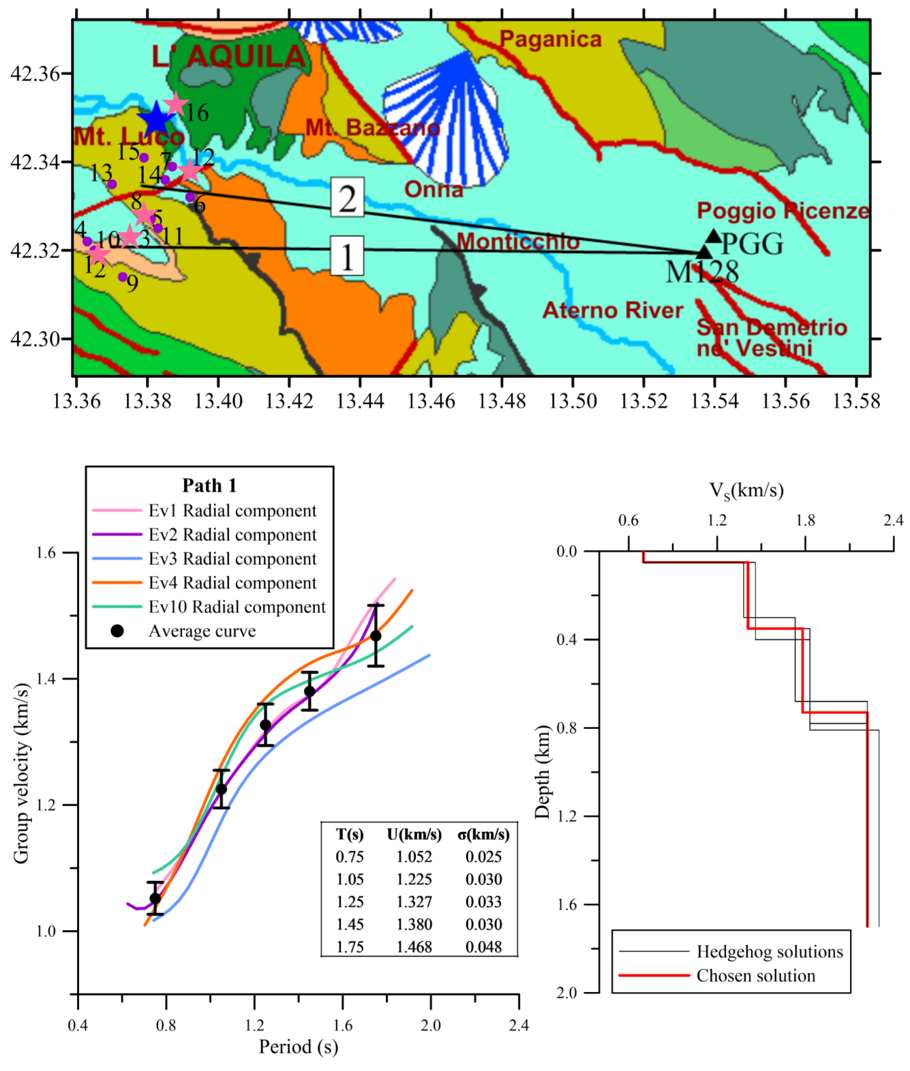 Fig. 4 In the top: Location of the analysed aftershocks (star, for events with ML≥ 3.2; filled circle for events with 2.0 < ML < 3.2) and of the recording stations M128 (INGV-RAIS network) and PGG (RAN network). The investigated path 1 and path 2 from aftershocks to the recording stations, and the 6 April 2009 earthquake (blue star) are also shown. In the bottom: Rayleigh wave group velocity dispersion curves of the fundamental mode, extracted from the aftershock recordings at the M128 station, along the path 1. VS models are obtained from the non-linear inversion of the average dispersion curve and error bars.
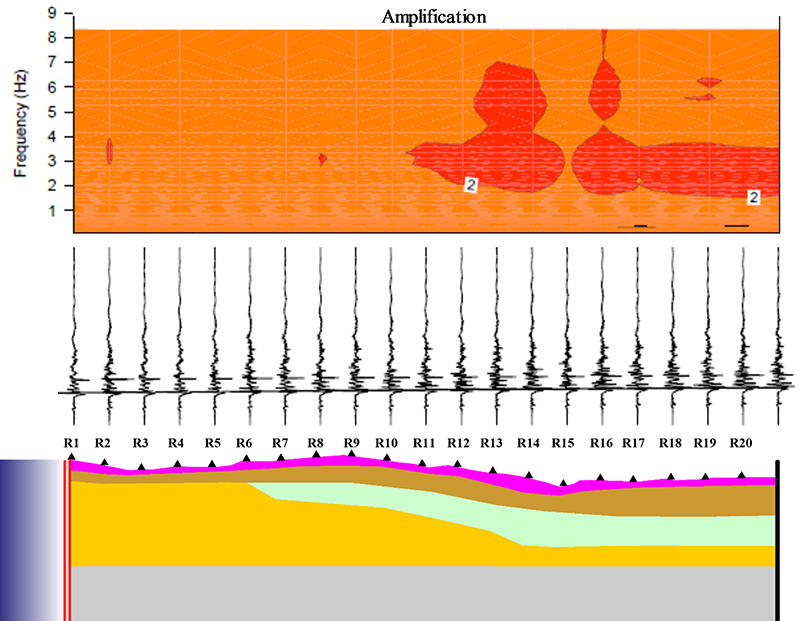
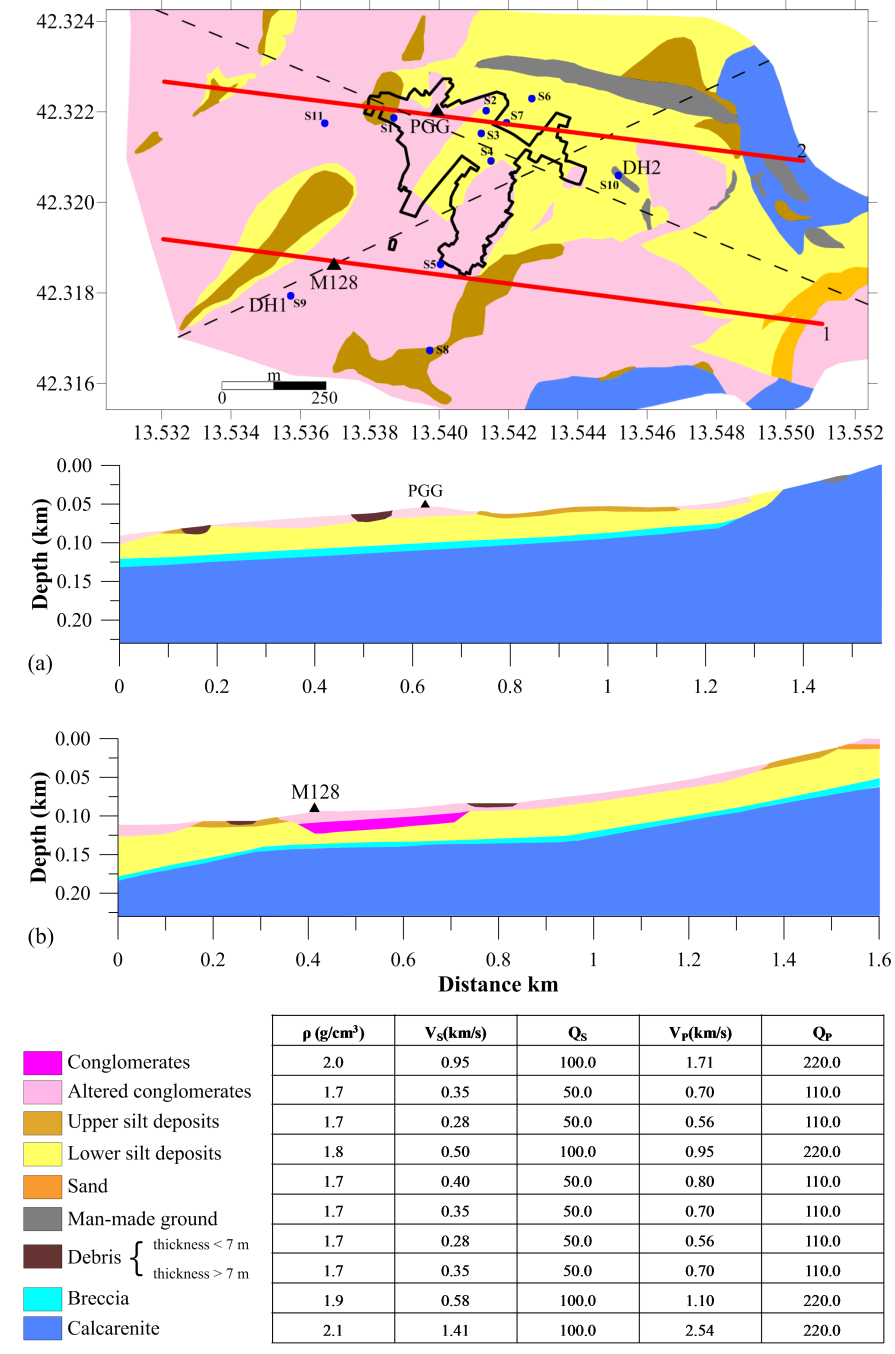 Fig. 5 Computing 2-D cross-section through the station PGG with physical parameters of lithotypes.
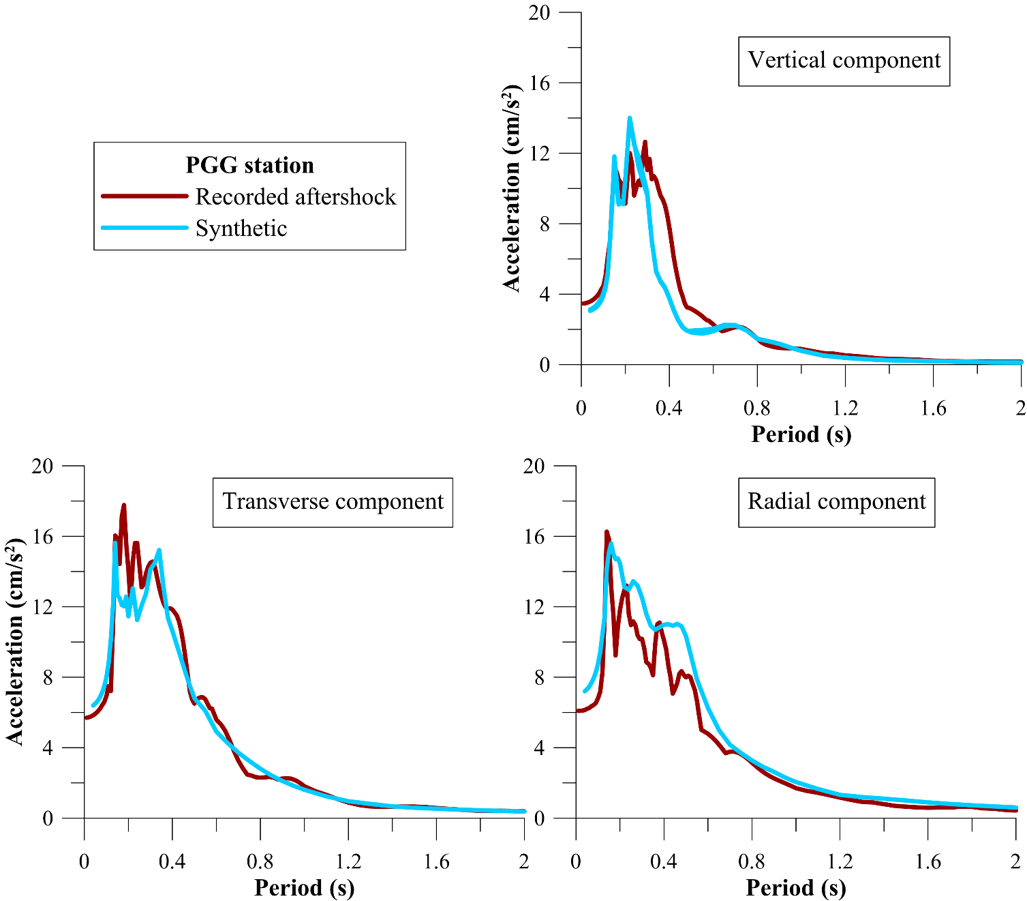 Fig. 6 Recorded and synthetic response spectra (computed for 5% damping) at the station PGG for the aftershock on 12 July 2009.
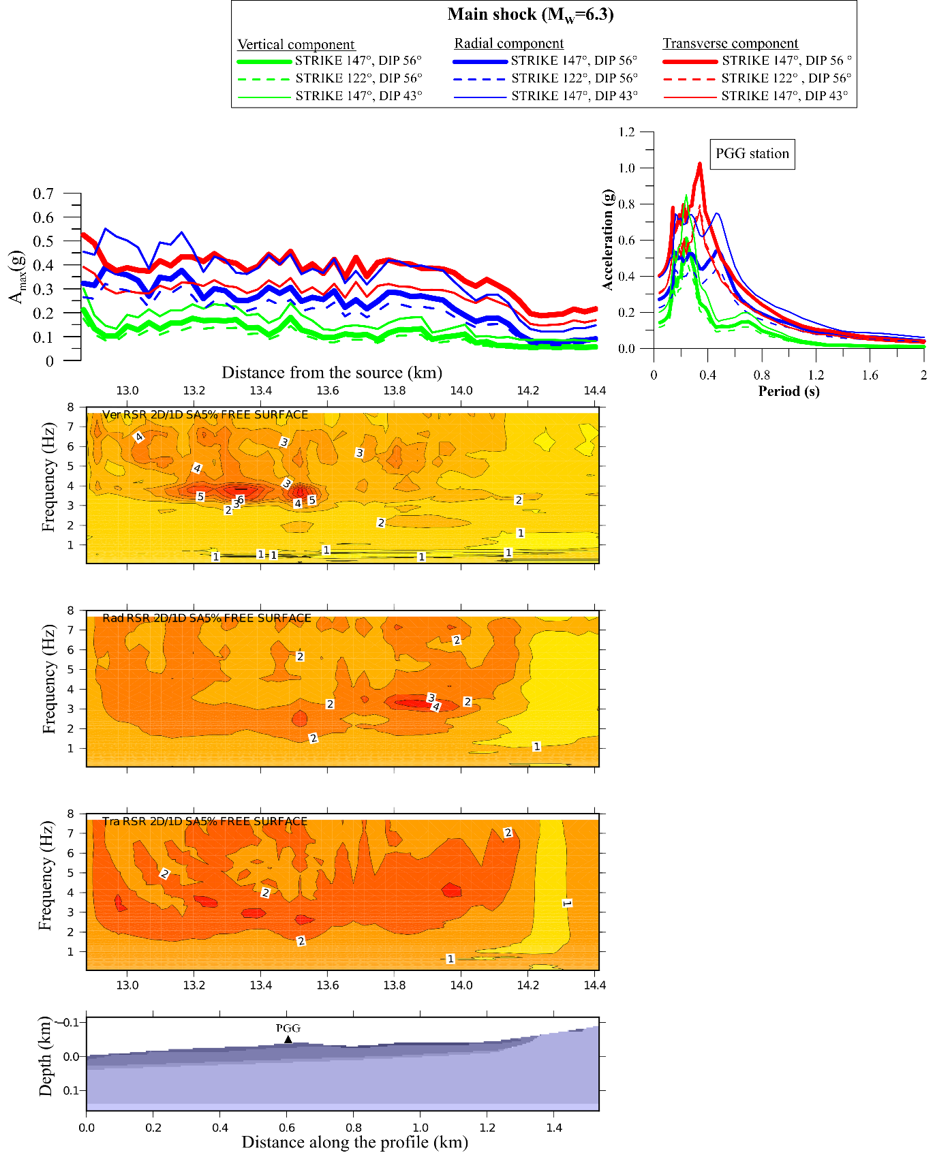 Fig. 7 Variability of the peak ground accelerations (Amax) along the computing cross-section and of response spectra (5% damping) computed at the PGG station site, by varying literature values of dip and strike for the 6 April 2009 earthquake (MW=6.3). Spectral amplifications (RSR 2D/1D) are relative to the computation for strike 147° and dip 56°. From the top vertical, radial and transverse components of the computed ground motion.